National Aeronautics and Space Administration
Goddard Space Flight Center
ICESat banner
Photo Gallery: Animations
Photo Gallery: Animations
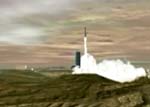
ICESAT LAUNCH RENDERING
 Windows Media
Animation includes the launch, separation once in orbit and a description of the Glas Instrument
Created by Christa D Budinoff, Visioneering
HOT TOPIC: SCIENTISTS EAGER TO STUDY ICE
 Animation 1 (46.2 MB)
Click here for text of this animation
LOOKING DOWN WITH LASERS
 Animation 2 (11.6 MB)
Click here for text of this animation
ICESat: LASER LIGHT MEASURES EARTH'S ICE
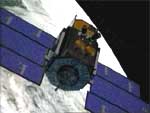
The newest addition to NASA's fleet of Earth observing satellites has only one scientific instrument. The satellite is called ICESat; the scientific instrument it carries is called GLAS, the Geoscience Laser Altimeter System.
ICESat has been developed to answer some important questions about our changing planet. Experts designed the GLAS instrument principally to measure changes in the overall surface elevation of the polar ice sheets through time. This kind of research is vital to understanding how sea levels might change around the world as well as other fundamental aspects of worldwide climate conditions.
But ICESat's mission only begins with measurements of ice.The system will also make important measurements about clouds, from cloud height to cloud structure. It will also help researchers measure land surface topography, as well as make determinations about surface feature characteristics, including reflectivity, vegetation heights, as well as snow and sea-ice surfaces.
Back to TopNEAR-POLAR ORBIT, WORLDWIDE MEASUREMENTS
The ICESat satellite left Earth from the Vandenburg Air Force Base in California. It rode into orbit onboard a Boeing Delta II rocket, model 7320.
Manufactured by Ball Aerospace, the ICESat spacecraft will initially fly at 367 miles (590 km) above the Earth. It's designed to operate for a minimum of three years, delivering data to Earth-bound scientists every day.
Satellites move fast-more than 16,000 miles per hour-and precise navigation while on orbit isn't a simple matter. That's why the ICESat vehicle has state of the art navigation systems to keep it pointed in the right direction. Star trackers are major parts of a system that will tell us where the GLAS lasers are pointed. Additionally, the satellite incorporates two highly advanced "Blackjack" GPS receivers, allowing mission engineers to keep track of ultra-precise locations of the spacecraft while on orbit. NASA's Jet Propulsion Laboratory developed the Blackjack GPS system to provide highly precise global positioning information.
ICESat will collect data about the Earth using the lasers on the GLAS instrument. The orbit of the satellite is such that the ground track, of the vehicle-- that is, where the laser pulses hit the Earth--will move westward as the Earth turns. Because of its near-polar orbit around the globe, the greatest number of data points collected by ICESat will naturally be collected near the poles. But its mission isn't just a polar one. Because GLAS operates continuously, the satellite will also collect important information around the rest of the world, too, with important measurements of clouds, vegetation, land surface reflectivity, land surface elevation, and more.
Back to TopTHROUGH THE LOOKING GLAS
GLAS-the Geoscience Laser Altimeter System-is the only scientific instrument aboard Ice, Cloud and land Elevation Satellite. The large ncylindrical side of the satellite comprises the biggest part of the GLAS instrument. It's the one-meter observatory mirror, the part of the instrument that detects reflected pulses of laser light from the Earth below. Beside that large mirror
CRISSCROSSING GREENLAND BY PLANE
Initial research into Greenland's ice cap using lidar began in 1993 when a team from NASA's Wallops Island Flight Facility surveyed the area. Flying an aging but sturdy aircraft called a P-3B, altitude measurements were taken again in 1998 and 1999 for comparison. Researchers could essentially duplicate airplane flight paths due to a highly precise Global Positioning System (GPS) flown onboard.
LIDAR: MEASURING TERRAIN ON EARTH AND ELSEWHERE
Lidar offers diverse scientific disciplines powerful tools for exploration. Besides being used to study Greenland's ice cap, lidar has been used to study coastal erosion on both the east and west coast. Additionally, a lidar system managed by the Goddard Space Flight Center is currently orbiting Mars as part of the Mars Global Surveyor spacecraft, engaged in a detailed mapping project of the red planet.
ICE: THE PLANET'S THERMOSTAT
Here we begin with a view of Greenland as it may have looked 100,000 years ago. Moving in, notice what happens as the climate begins to warm. Glaciers surrounding the edge of Greenland begin to slump, then melt, adding billions of gallons to the oceans. The humid air from the coasts rises to the interior, where it cools and dumps snow. When the camera pulls back, we see Greenland's ice cap much reduced in size, resulting in measurable and significant changes to the world's climate.
Back to Top
STREAMS OF ICE
Recent observations by a NASA-launched Canadian spacecraft called Radarsat are giving scientists a remarkable view of two fascinating features of Antarctica's landscape. Over a twenty-four day span, scientists used two images over identical regions of Antarctica in a technique called interferometry. Their comparative analysis of the images helped develop the following ice stream animations on the west side of the continent, showing flow rate and direction to an extent never before possible.
VECTOR ANALYSIS OF FLOW
In this visualization, longer black lines indicate a faster rate of flow than shorter lines. The fastest ice streams can move 400 to 500 meters a year, a blazing speed compared to tributary speeds of little more than 10 meters a year.
Experts say the new information can help describe large scale changes to the Antarctic environment, as well as historical models about geological change.
Back to Top
HOW THEY WORK: A VIRTUAL MODEL OF ICE STREAMS
Experts still aren't positive how ice streams actually work. The current theory says that tributaries of slower ice come together to create larger streams, often at points where elevation and terrain merge and act like a sluice. At these convergences, ice then literally slides across a lubricated bed of oceanic muck covered by a millimeter thin layer of water, gaining strength as it drives toward the ocean.
BRIGHT WHITE REFLECTS LIGHT
The polar caps not only hold much of the planet's total fresh water, but also play an important role in regulating the Earth's temperature. The relevant characteristic is called albedo. It's a measure of how much radiation, or light, is reflected from a body. Similar to how a white shirt helps keep a person cooler in the summer than a black shirt, the vast stretches of polar ice covering much of the planet's top and bottom reflect large amounts of solar radiation falling on the planet's surface. Where the ice caps so appreciably recede, sunlight that otherwise would have been reflected back into space would get absorbed by the darker, denser mass of ocean and land beneath. As light is absorbed, the environment is heated, thus intensifying a feedback loop: a warmer planet yields more ice melting thus an even warmer planet.
Back to TopIS THE OCEAN RISING?
This animation provides a more close-up perspective of the relationship between ice and solar reflectivity. As glaciers, the polar caps, and in this case, icebergs melt, less sunlight gets reflected into space. It is instead absorbed into the oceans and land, thus raising the overall temperature, and adding energy to a vicious circle. Of the many concerns voiced by scientists who study global warming trends, rising ocean levels is one of the most dramatic. An average rise in global ocean levels of just a few inches could have devastating effects on coastal towns, cities, and ecosystems. Why then is even the slightest risk of a shrinking polar cap not sounding alarms all across the world's lowland regions?
It comes down to a simple principal proved thousands of years ago by the Greek philosopher and scientist Archimedes. He showed that a body, in this case the floating ice of the North Pole, immersed in a fluid is buoyed up by a force equal to the weight of the displaced fluid. In other words, since the northern pack ice is already floating its melting would not independently cause ocean levels to rise. However, the attending planetary conditions necessary to facilitate polar melting would likely have other enormous effects on the environment, including the likely melting of the southern polar cap. As the ice over Antarctica is NOT floating, a corresponding rise in the world's sea level would almost certainly result if it melted.
Back to TopRADARSAT: INTERNATIONAL COLLABORATION REVEALS A CONTINENT
In the following collection of images, we look at various regions of Antarctica, the southernmost continent. The satellite that collected the data for each of these scenes is called Radarsat, a Canadian spacecraft placed on orbit by NASA.
ANTARCTICA TOUR: ROSS ISLAND/McMURDO STATION
Ross Island is home to McMurdo Station, the largest permanent facility on the continent. Owned by the United States, McMurdo Station and its attendant airport called Williams Field are primary gateways to the rest of the frozen territory of Antarctica. Nearly 1200 researchers and support staff live at McMurdo during the summer months; about 230 remain year round.
The high point of Ross Island is Mt. Erebus, rising 3794 meters. It's also the most active volcano on the continent and one of the active volcanic vents that's responsible for the formation of the island. Many days of the year a plume can be seen emanating from the mountain's summit crater, which holds a unique lava lake. The mountain is essentially active all the time, producing small explosions from the lava lake several to many hundreds of times per day.
Back to TopMcMURDO DRY VALLEYS
These valleys found at the eastern edge of the Transantarctic Mountains are essentially snow free. Melt water from alpine glaciers essentially run into these valleys and feed a number of lakes and small ponds, but otherwise, it gets very little moisture. It's a delicate environment. But its relative protection from the harsher surrounding features of the mountains and East Antarctic Ice Sheet also provides a unique opportunity for intense study. The National Science Foundation maintains a long term ecological research site in the McMurdo Dry Valleys to study the area and ecosystem.
The area is also something of a practice facility. The cold, arid conditions provide a fairly good simulation of the surface of Mars. NASA engineers have used the Dry Valleys to test equipment and operational techniques in preparation for a chance to try their designs on the Red Planet.
ALLEN HILLS
Along the edge of the Transantarctic Mountains lay the Allen Hills. Ice pushes up against the slopes of the hills, nudging bits of debris and surface material along. There against the slopes that ice ablates rather quickly-it's worn away-by wind and solar insolation. Left behind, however, are the geological artifacts that most interest scientists, including fragments of meteorites. It is from the Allen Hills that several years ago scientists found a fragment of something they believe is an actual piece of Earth's second closest neighbor: Mars.
Back to Top
AMUNDSEN-SCOTT SOUTH POLE STATION
The U.S. National Science Foundation (NSF) operates the Amundsen-Scott South Pole Station, but it's been a way station for researchers from around the world. Seen from Radarsat, the main geodesic dome is visible along with several storage facilities. Extending to the upper right from the research station is a long line. It's a highway of sorts, heading to a now abandoned antenna facility. The bright band below the main station is the airfield for the facility 14,000 feet long.
South pole station is important to Radarsat researchers in that it provides a vital point of cartographic reference in every pass the craft makes over the continent.
EAST ANTARCTIC ICE STREAMS / WEST ANTARCTIC ICE STREAMS
Prior to the Radarsat mission, scientists knew little about the East Antarctic Ice Streams, draining into the Filchner Ice Shelf. Now for the first time they've been mapped in their entirety. They're actually enormous glaciers, stretching like conveyors of cracked ice and snow across vast stretches of the continent. The Recovery Glacier, one of the principal channels comprising the East Antarctic Ice Streams, reaches over 800 kilometers into the continent's interior. Several of the tributary glaciers feeding into Recovery and the large Slessor Glacier extend for more than 250 kilometers.
The West Antarctic Ice Streams are to Antarctica what a fast eddy is to an already dynamic river. Moving roughly 500 meters a year-significantly faster than a typical glacier-the ice streams are hundreds of kilometers long and up to fifty kilometers wide. By comparison, the frozen material lining these remarkable rivers may move only a couple of dozen meters a year.
Radarsat is an excellent tool for scientists to study these fascinating formations. If you were standing on the gently sloping ground they'd be very hard to detect. From space, however, the West Antarctic Ice Streams show up as clear as a river seen from a plane. Experts are still not positive about why they move so quickly; unlike water rushing down a trough there isn't much of a slope to pull them. Theories include a lubricated stream bed of some sort, helping the ice rush across the frozen continent like waxed sled runners in a groove.
Back to TopSNOWDUNES RIPPLE THE ANTARCTICA'S SURFACE
Radarsat also enabled researchers to gain a better understanding about a surface feature found only at the bottom of the world. These snow dunes are believed to be highly stable surface features. They're made of ice particles, or grains, of different sizes. Individually each dune is nearly impossible to see without the aid of satellite remote sensing systems, but the range of the snowdunes is larger in total area than the state of California. Unlike their sand analogues in more familiar deserts around the globe, these dunes tend not to rise nearly as high. Stretching for hundreds of kilometers, these dunes rise only 2 to 3 meters but often have a periodicity of more than 2 kilometers; that means there may be as much as 2 kilometers between each dune. Their length and relative heights raise interesting questions for researchers. One hypothesis about their formation suggests that low intensity atmospheric waves formed in the lee of small hills help cause the dunes, but so far conclusive answers are elusive. Radarsat "sees" the ridges of the dunes not by traditional shadows, but by the way the radar signal is reflected back to the satellite. Because wind sorts grains of snow according to size on the up-wind and down-wind sides of hills, Radarsat's view of the area looks to be measuring height, when in fact it's measuring radar reflectivity. That reflectivity helps scientists determine what types of materials line the sides of the dunes, and thus help them determine how they came to develop.
Back to TopLAKE VOSTOK
More than two miles beneath the icy cloak shielding Antarctica from the sky hides a massive fresh water lake. Seen from Radarsat, the lake appears as a flat plain surrounded by the sandpaper of craggy ice. As the topographical ice sheet flows over the subglacial lake, surface features smooth out. Researchers are considering a drilling mission to the lake for exploration of this remote environment. It remains in liquid state partially due to geothermal heating and partially because of the insulating properties of such a thick ice blanket above. The drilling project faces certain technological challenges. Major mechanical work is always difficult in the bitter cold. But from a more research oriented perspective, there's the issue of how to drill into the lake from above without contaminating a sample from below with the drilling apparatus.
Lake Vostok is also a human foothold on the continent. It was at Vostok Station, located at the southern end of the lake, that Russian scientists recorded the coldest temperatures on Earth. Note the long, lonely road leading across the ice to the outpost at Vostok. At the end of the road, the short, white dash in the ice marks the station's airport runway.
Back to TopLARSEN ICE SHELF
In 1978, scientists predicted that global warming would lead to a disintegration of Antarctic Peninsula ice shelves. Spaceborne data indicate that this prediction may be coming true. In these before and after images, note the dramatic change in the apparent shoreline. Scientists captured the first image in using the ERS-1 satellite in 1992. As seen in the second image, collected by Radarsat in 1997, huge changes have come to the coastline. In 1995, a 2000 sq. kilometer section of the ice shelf collapsed into thousands of fragments that eventually drifted out to sea. Researchers are still debating why the ice shelf broke up so dramatically, and what significance the break up has for interpreting local versus global changes to the environment. Theories include a series of warmer than usual summers that may have caused high levels of surface melting, or an overall climate warming trend.
Back to TopFIMBUL ICE SHELF
Icebergs form when hunks of ice break away from glaciers pushing into the ocean. Ice shelves are the edges of those glaciers, extending out into the ocean faster than ice bergs can break off from the edge. The Fimbul Ice Shelf has remained relatively consistent in its appearance for the last thirty years, but researchers are paying close attention to changes. Ice shelves are considered to be particularly sensitive to climatic changes and scientists have detected a marked retreat of several along the Antarctic Peninsula.
Note the fascinating formations along the Fimbul, believed to be the product of glacial ice flowing over rocky outcroppings and islands.
LAMBERT GLACIER
Covering more than a million square kilometers, Lambert Glacier is one of the world's longest and largest. It's more than 400 kilometers long, emptying a significant portion of East Antarctica into the Amery Ice Shelf. Much like a major river system, Lambert Glacier is fed by a complex series of tributaries.
Back to Top
AMERY ICE SHELF
At the mouth of the Lambert Glacier spreads the Amery Ice Shelf. For the most part, ice shelves grow from glaciers pushing down into the sea. To a lesser extent they also grow from precipitation. Ice Shelves respond to climate change faster than sheets of ice on the ground or continental glaciers. Continued study of ice shelves like Amery are intended to help scientists better understand what sorts of changes are happening to the world's climate in general. Of particular interest is whether observed changes in various ice shelves are the result of natural processes or are anthropogenic, that is, the result of actions taken by humans.
RONNE ICE SHELF
The Ronne Ice Shelf grows primarily due to a constant flow from inland ice sheets. Where shearing stresses are greater than the strength of the ice itself, cracks form. These cracks ultimately widen and spread like varicose veins in the frozen skin of the coast, only to break loose and become icebergs. Early in the 1990's a slab of ice the size of Delaware broke free from this area. Interestingly, as ice shelves break up into icebergs, overall sea level generally doesn't rise. That's because ice shelf are ostensibly already floating in the water. Floating ice shelves, connected to the shore by ice sheets and glaciers, displaces a volume of water equal to the volume of water contained in the shelf. When a berg breaks off, or calves, there is no new water to displace. It simply separates from shore...and goes on its way.
Back to TopWritten and Produced for Television and The Web by: Michael Starobin
Executive Producer: Wade Sisler
Scientific Consultants:
Dr. Chris Shuman
Dr. Claire Parkinson
Dr. Robert Bindschadler
Follow me on Twitter!


- NASA Official: Dr. H. J. Zwally
- Webmaster: Jairo Santana
- Page Last Updated: Jul 27, 2016