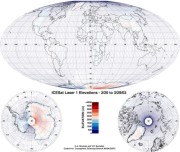
Laser 1 - 2/20 to 3/29/03
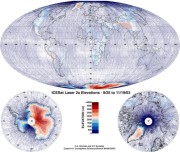
Laser 2A - 9/25 to 11/19/03
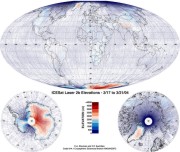
Laser 2B - 2/17 to 3/21/04
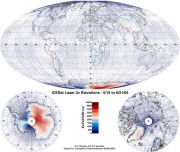
Laser 2C - 5/18 to 6/21/04
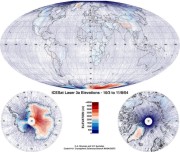
Laser 3A - 10/3 to 11/8/04
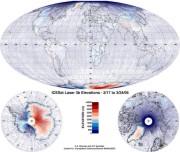
Laser 3B - 2/17 to 3/24/05
Laser 3C - 5/20 to 6/23/05
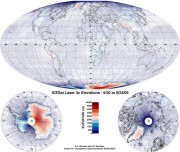
The maps show all the elevation data that have been gathered up through the Laser 3c period.
The lowest elevations (i.e. sea level) are shown in the darkest blue and the other colors represent elevations above sea level in 500 m increments (see scale bar). All elevations above 4000 m are represented by the dark red color.
White represents areas where no elevation data has been obtained; this includes gaps along a single track as well as between adjacent tracks. Note the relative scale of the polar ice sheets compared to the World's other high elevation land areas (some areal distortion is caused by the map projection used).
Laser 1 - 2/20 to 3/29/03
|
||
Laser 2A - 9/25 to 11/19/03
|
Laser 2B - 2/17 to 3/21/04
|
Laser 2C - 5/18 to 6/21/04
|
Laser 3A - 10/3 to 11/8/04
|
Laser 3B - 2/17 to 3/24/05
|
Laser 3C - 5/20 to 6/23/05
|